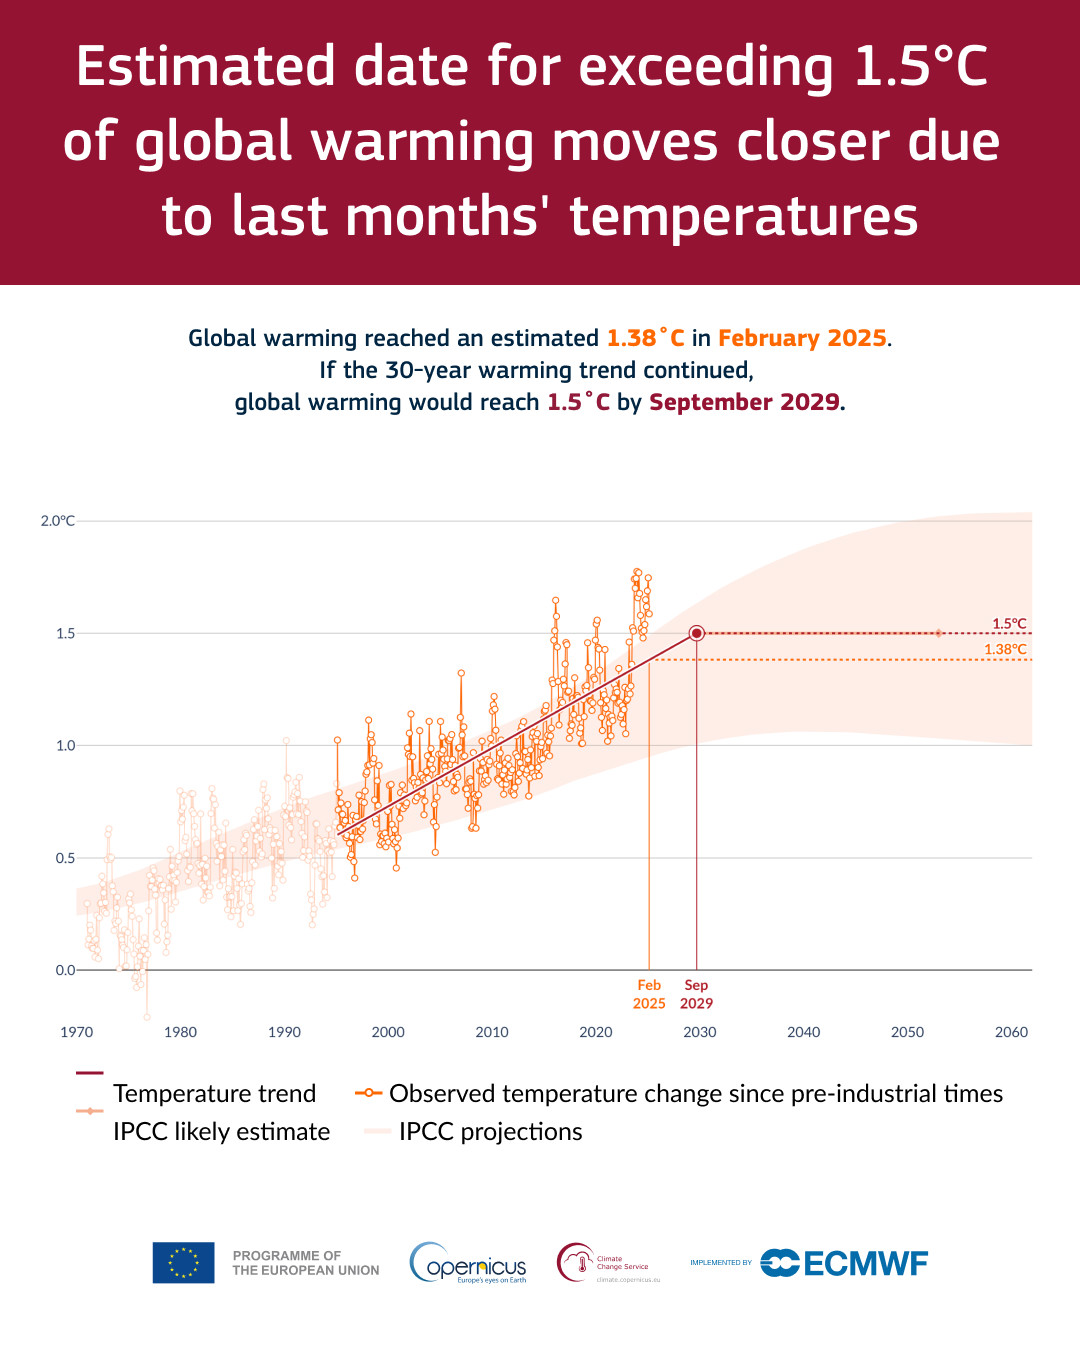
Please note that the 1.5°C limit set by the Paris Agreement applies to a long-term average of at least 20 years. The app shows an estimated start date of a time span over which the global mean temperature may reach 1.5°C.
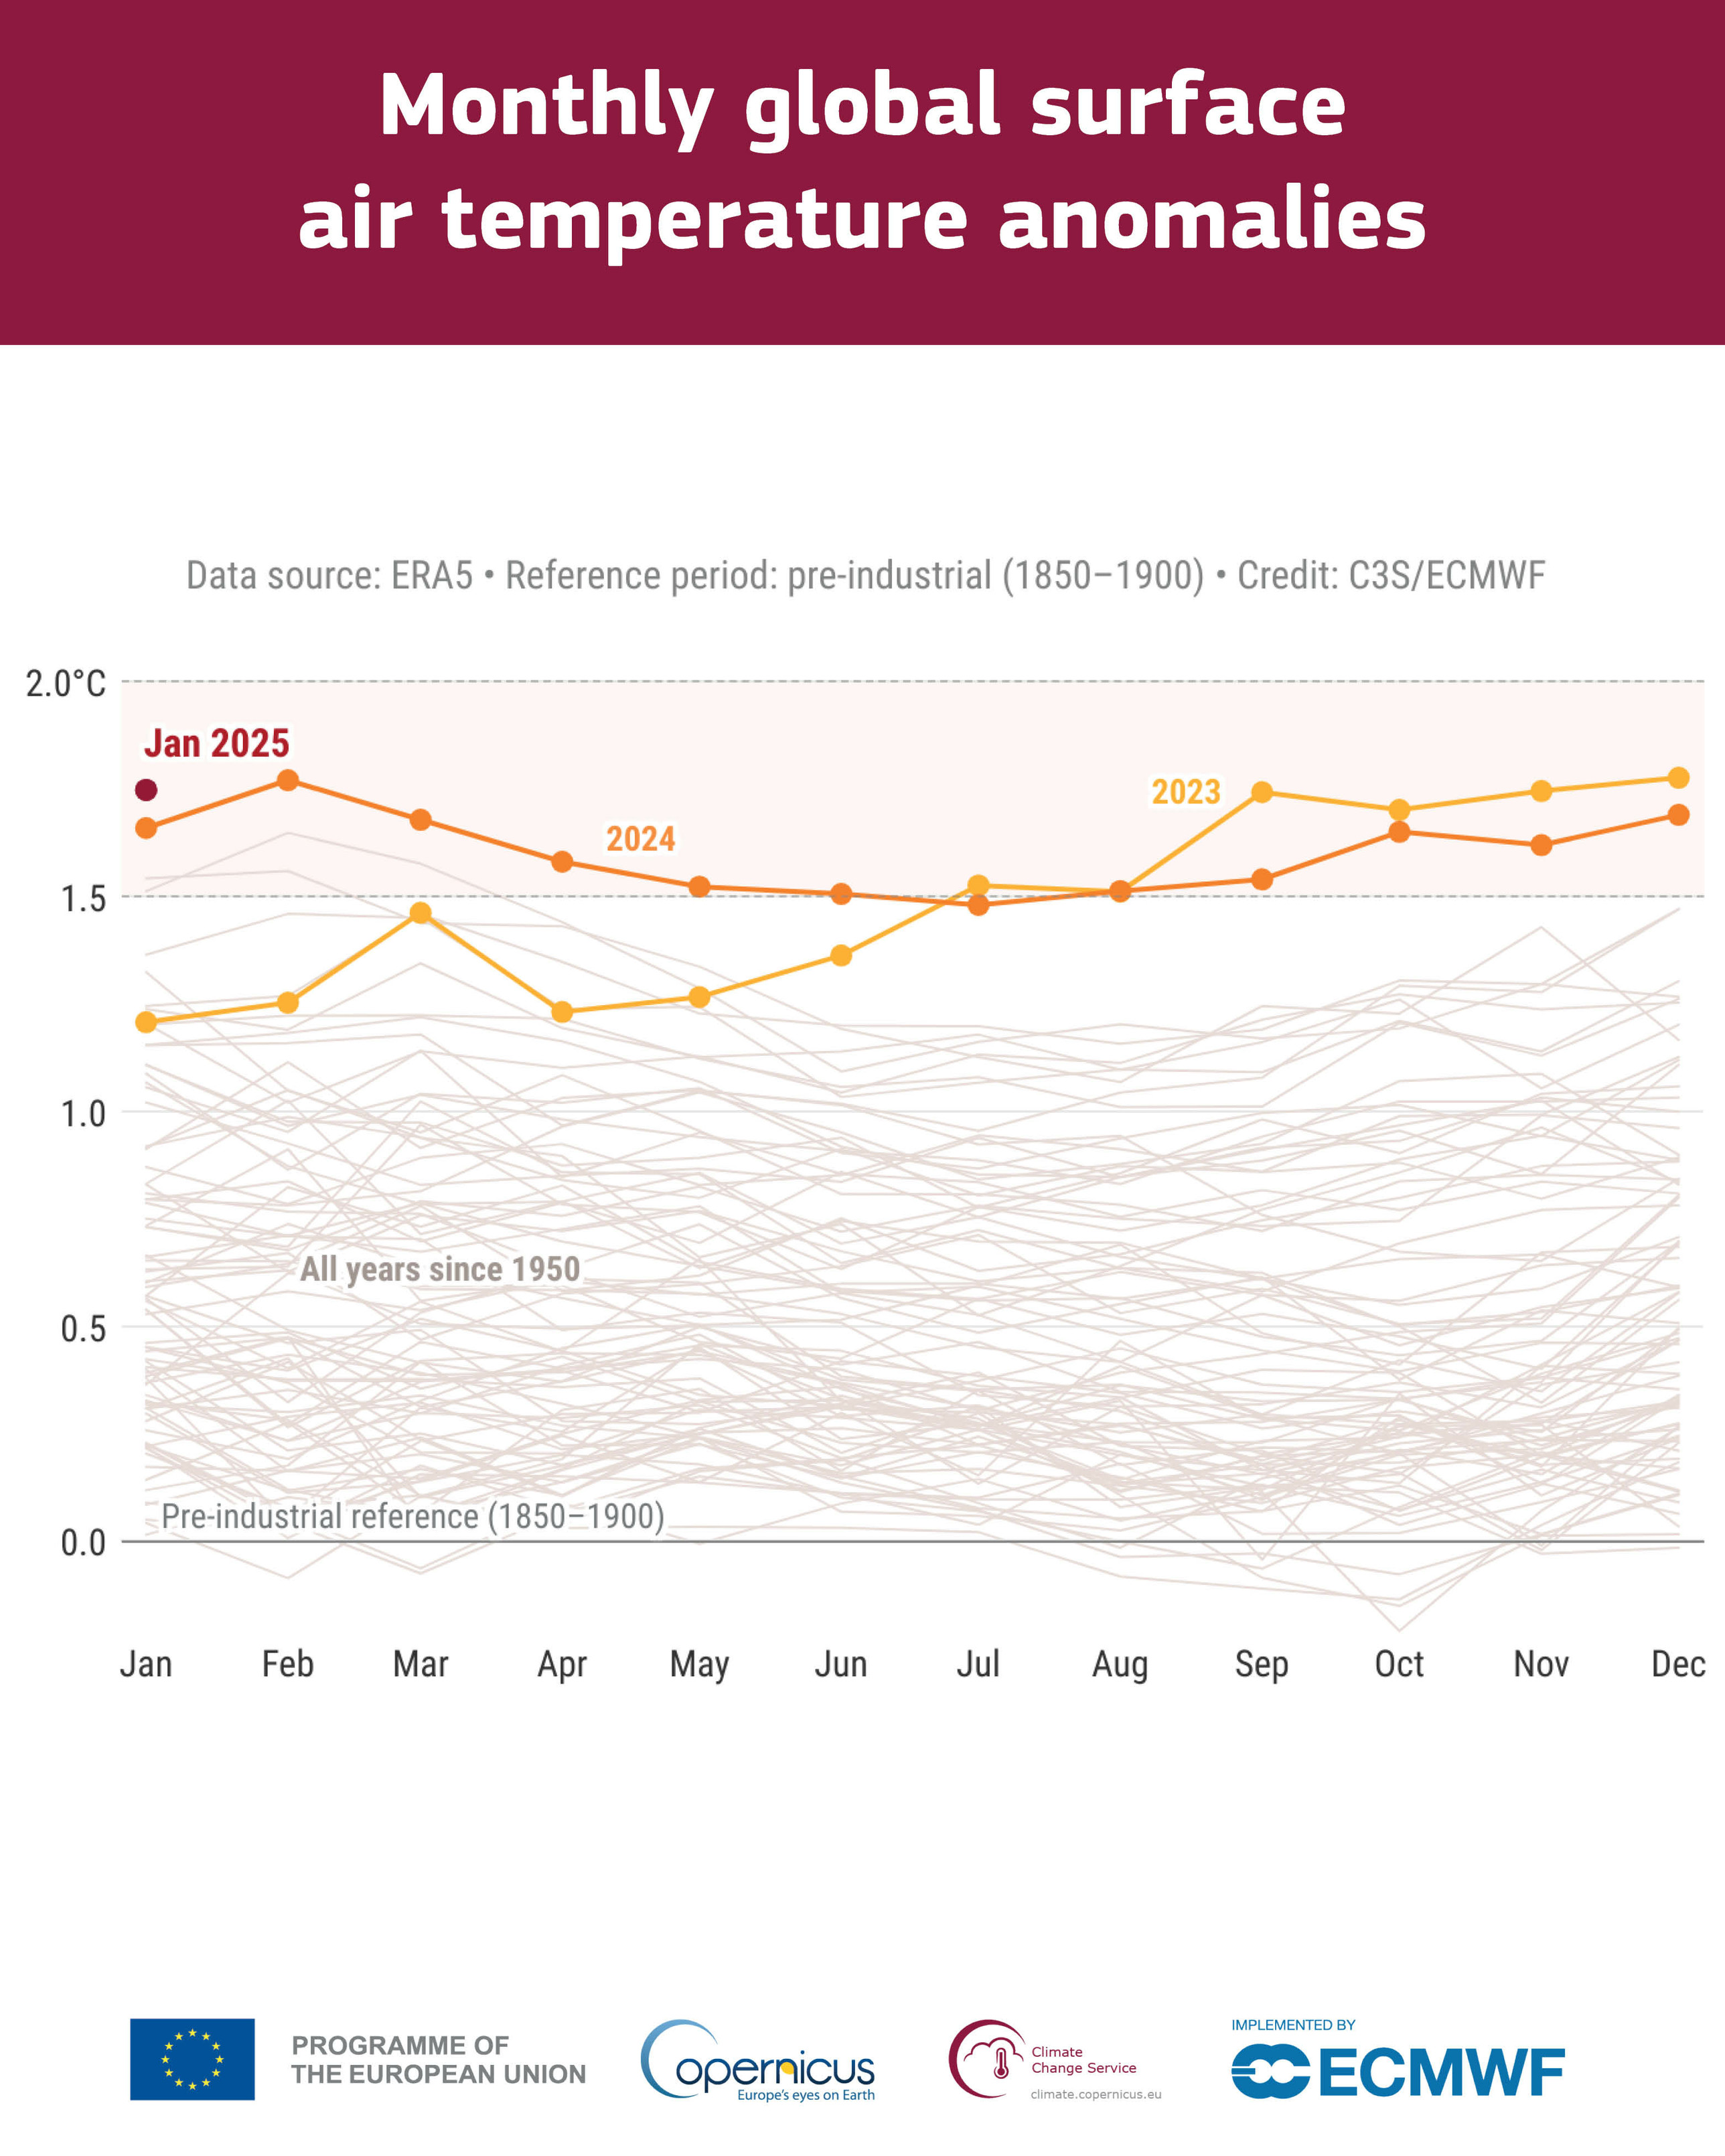
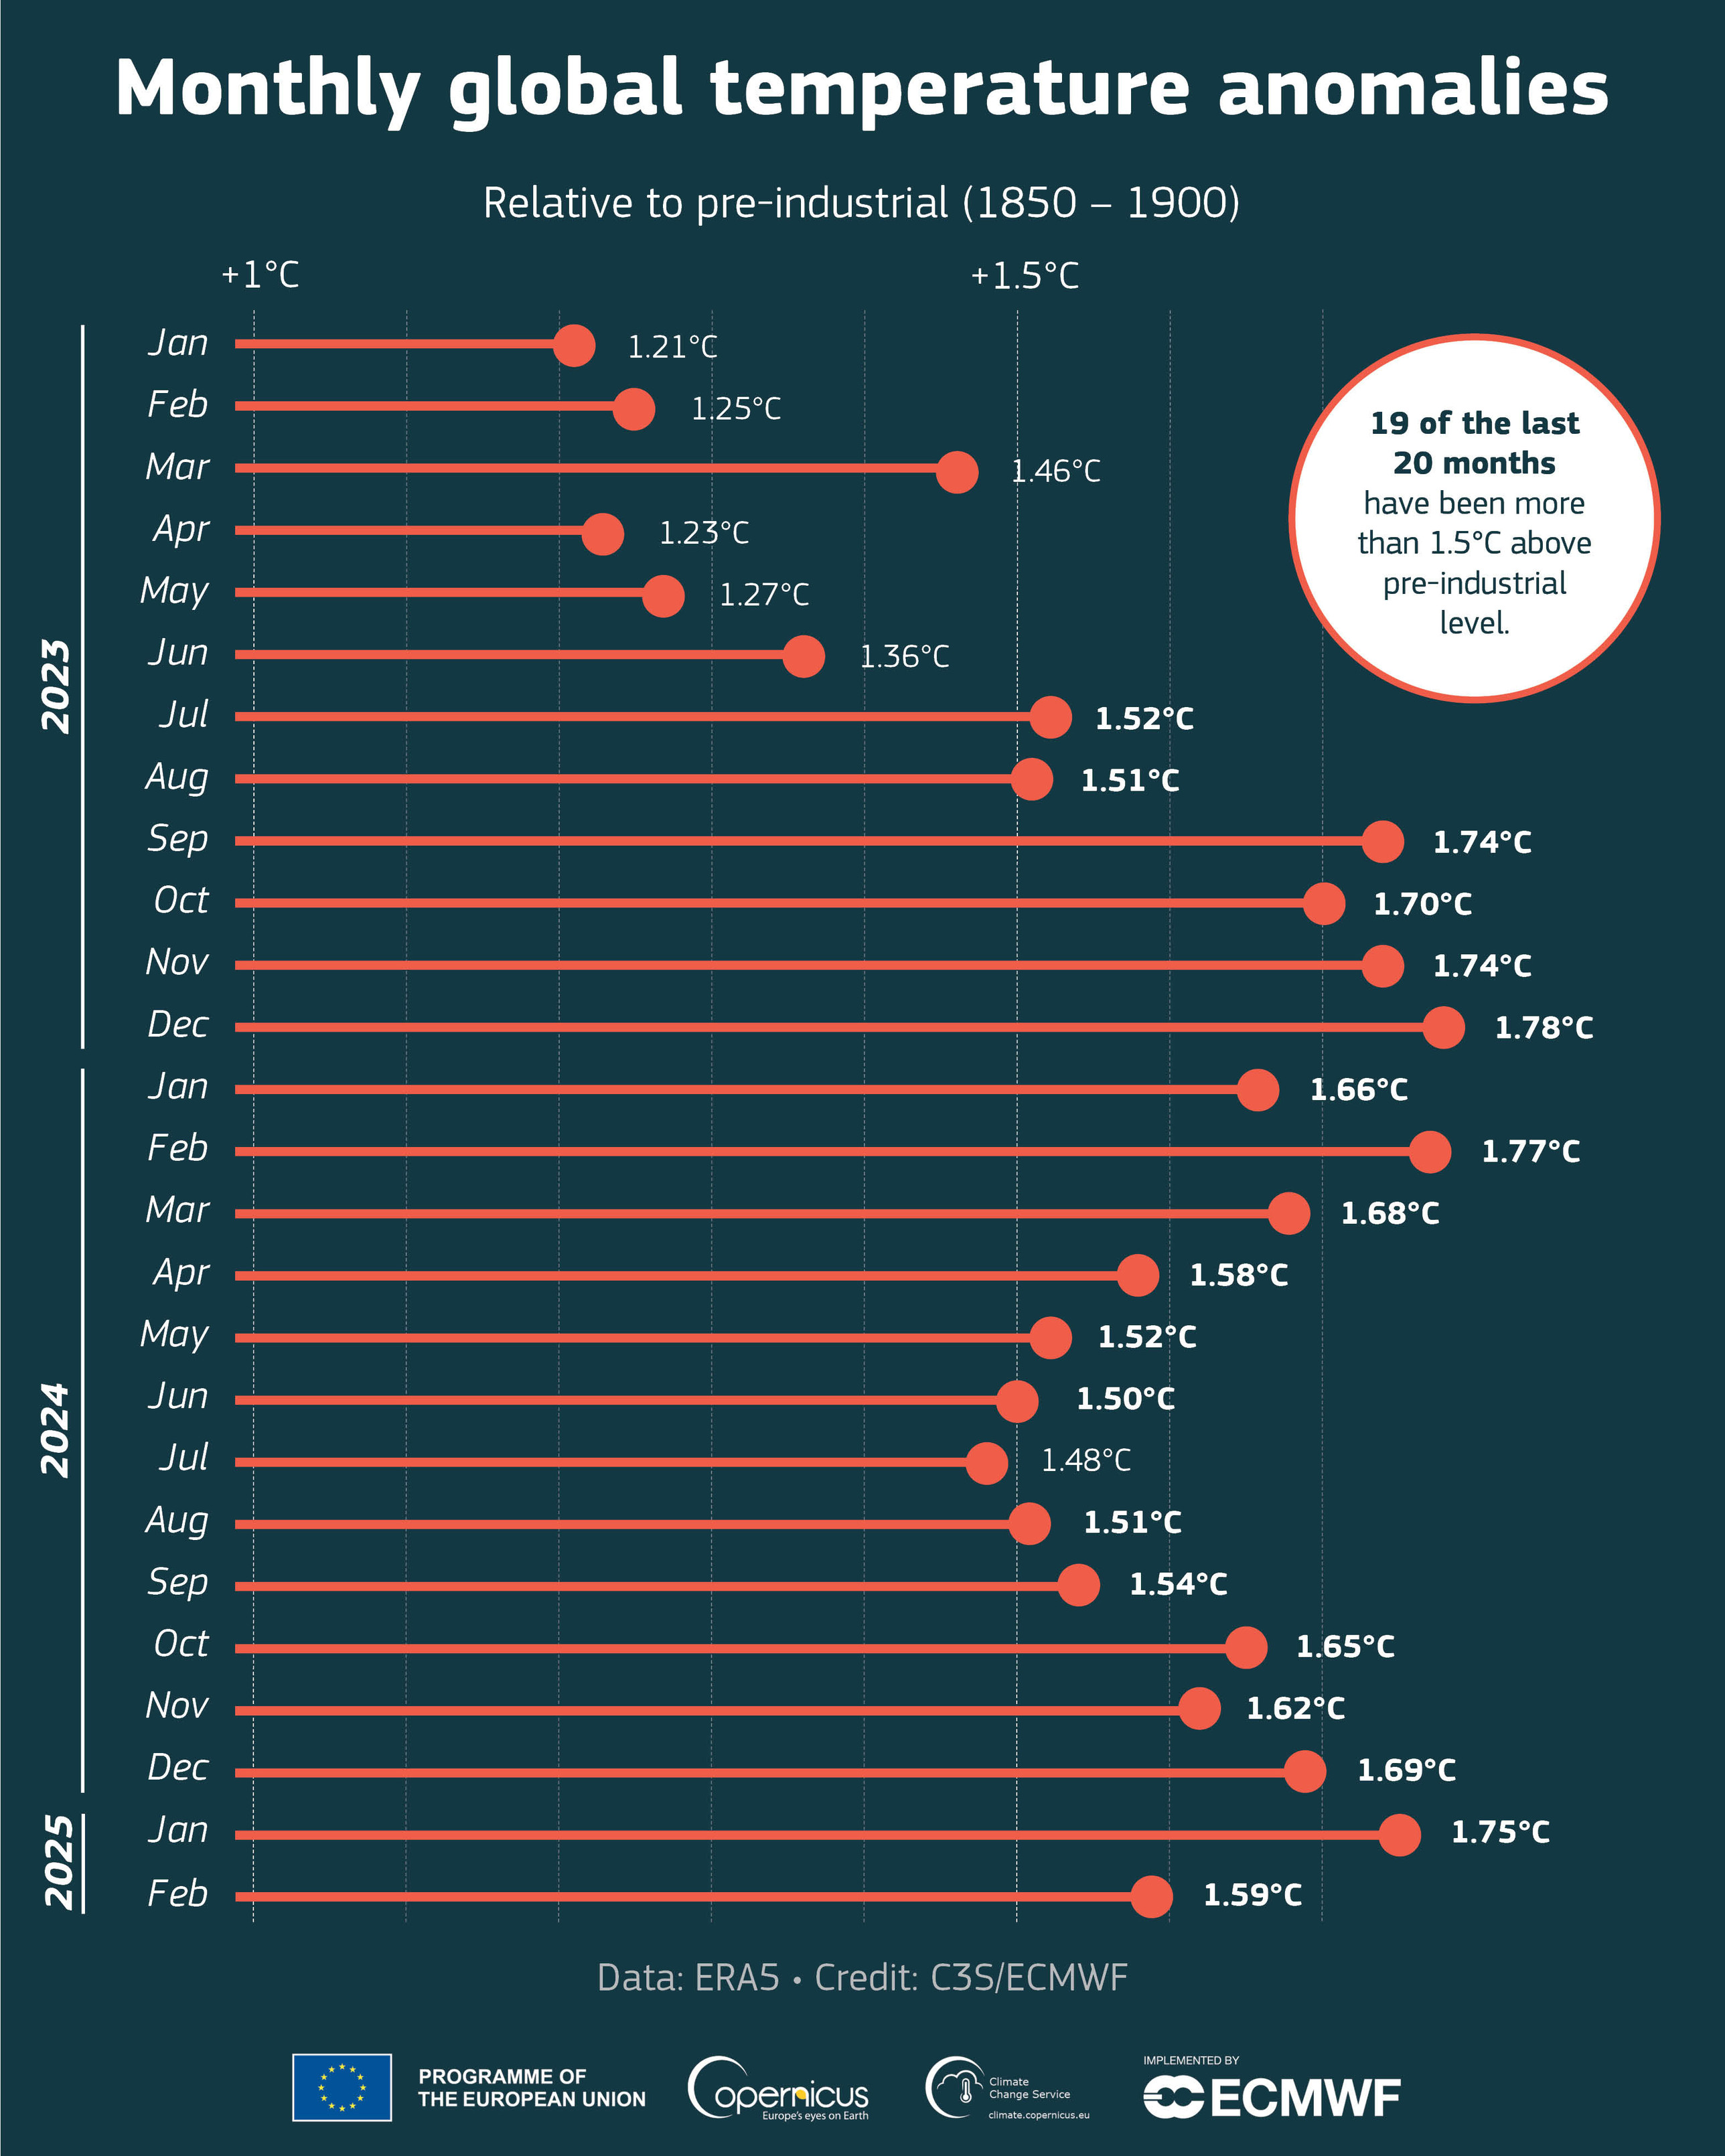
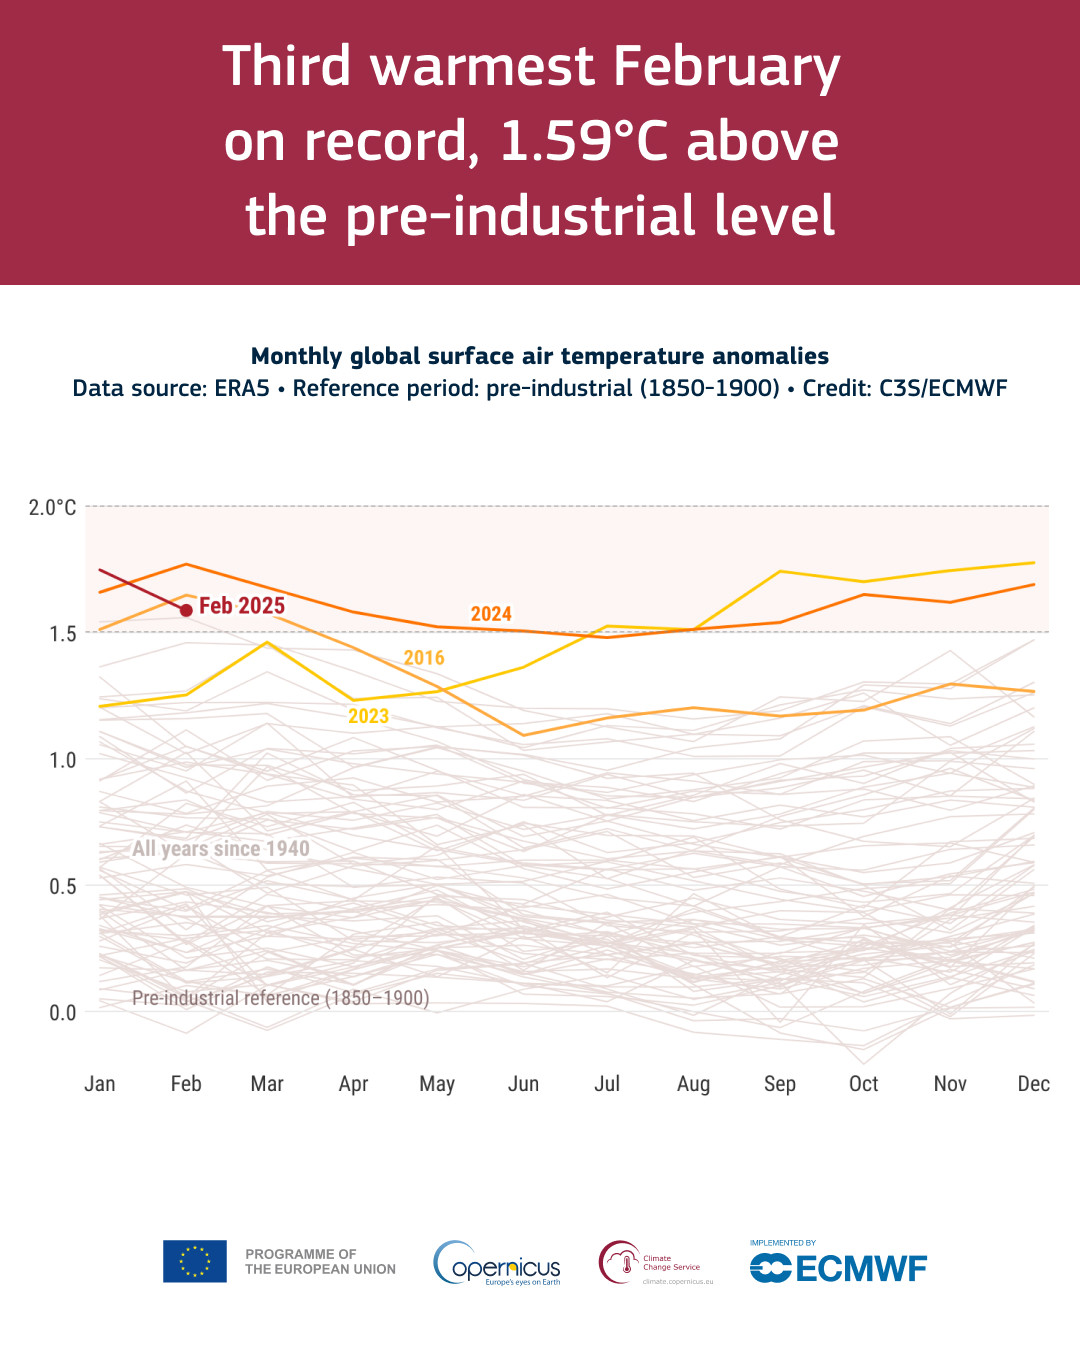
The app suggests that since February 2024, the estimated date at which the global average temperature may reach 1.5°C has moved 18 months closer, from March 2031 to September 2029, based on the record-breaking temperatures we have seen in recent months.
See for yourself https://apps.climate.copernicus.eu/global-temperature-trend-monitor/
The C3S global temperature trend monitor, based on #ERA5, allows you to explore how the estimate of the time to 1.5°C global warming has changed in recent years. While it should not be interpreted as a forecast, it does show trends in global warming.
Looking at the 12-month period from March 2024 to February 2025, we observed a global average temperature of 1.59°C above the pre-industrial level, and 0.71°C above the 1991-2020 average.
February 2025 was the 19th month in a 20-month period in which the global-average temperature was more than 1.5°C above pre-industrial level.
Dive into the analysis of the latest #C3S Climate Bulletin: https://climate.copernicus.eu/surface-air-temperature-february-2025?utm_source=socialmedia&utm_medium=ma&utm_campaign=surface-air-temperature-february-2025&utm_id=CB-02-2025
Last month, SSTs for 60°S-60°N remained very high for the time of year, with an average SST for February 2025 of 20.88°C, 0.42°C above the 1991-2020 average and the second highest on record for February.
Since early January, a resurgence of warm anomalies has been observed over the eastern Pacific. A temporary “brake” on global temperature rise due to La Niña is currently not in sight.
Explore the insights in the latest #C3S Climate Bulletin. https://climate.copernicus.eu/surface-air-temperature-february-2025?utm_source=socialmedia&utm_medium=ma&utm_campaign=surface-air-temperature-february-2025
On #InternationalWomensDay, we inspire young women to pursue science. Your talents can drive innovation and discoveries in climate and atmospheric fields, shaping our planet's future.
Have you read the latest monthly climate summary by #C3S? February 2025 set an all-time record low for global sea ice extent and ranked as the third warmest February. Find out more in our summary of the February 2025 Climate Bulletin. https://climate.copernicus.eu/february-2025-record-low-global-sea-ice-cover?utm_source=socialmedia&utm_medium=ma&utm_campaign=february-2025-record-low-global-sea-ice-cover
February 2025 saw dry conditions in central Europe, severe droughts in Spain & Türkiye, and wildfires in Argentina. Cyclones impacted SE Africa significantly. Get the hydrology highlights in the #C3S Climate Bulletin https://climate.copernicus.eu/precipitation-relative-humidity-and-soil-moisture-february-2025?utm_source=socialmedia&utm_medium=ma&utm_campaign=precipitation-relative-humidity-and-soil-moisture-february-2025&utm_id=CB-02-2025
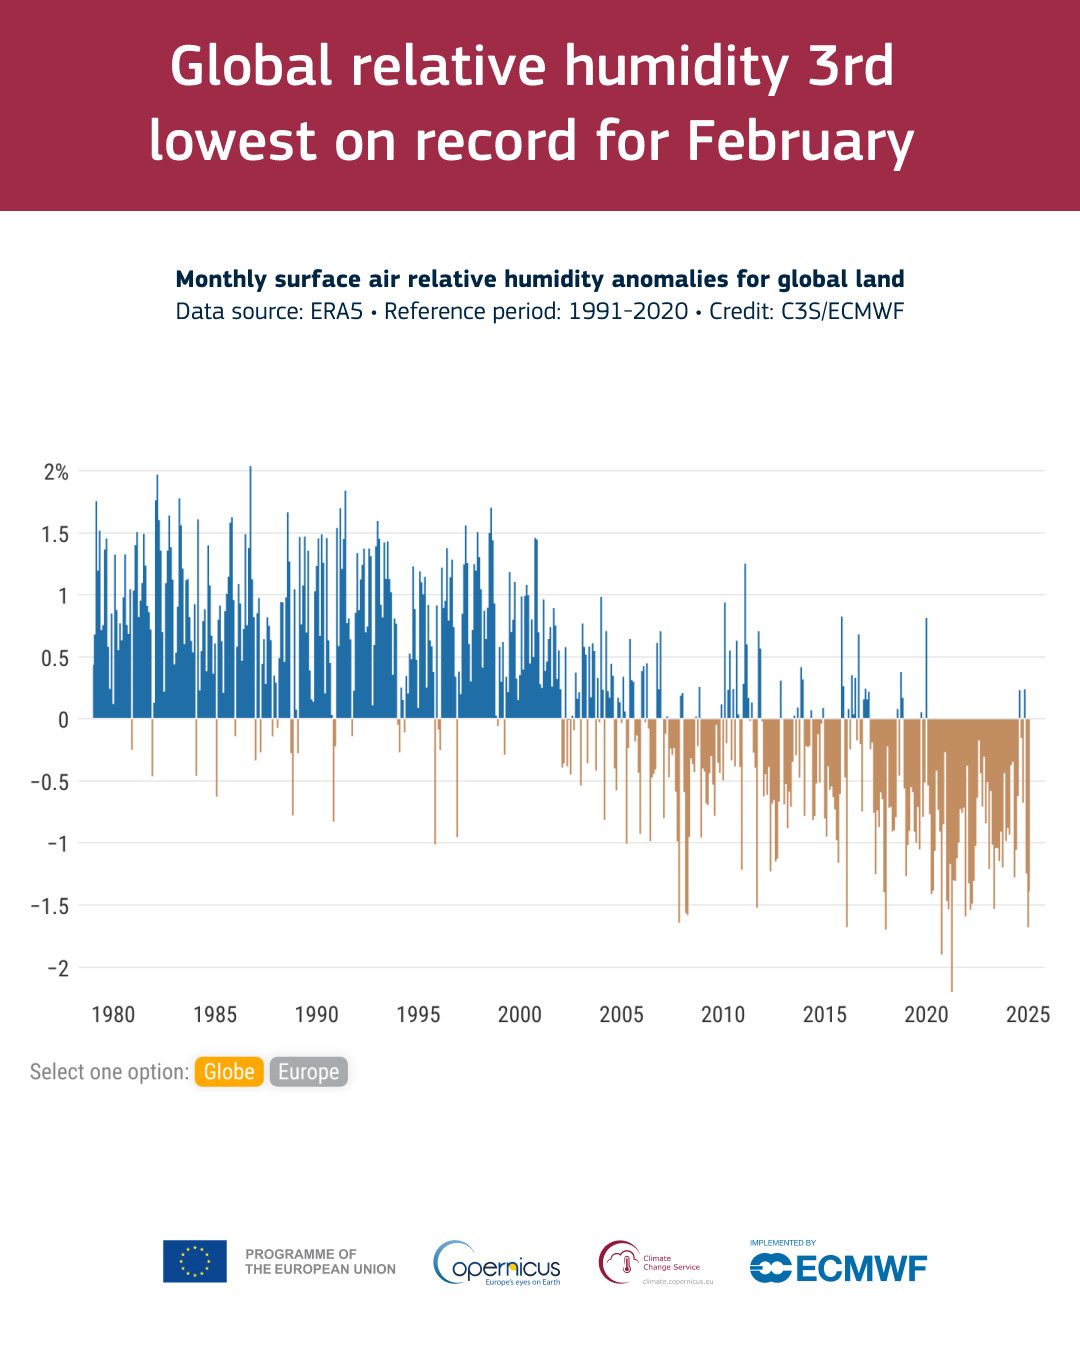
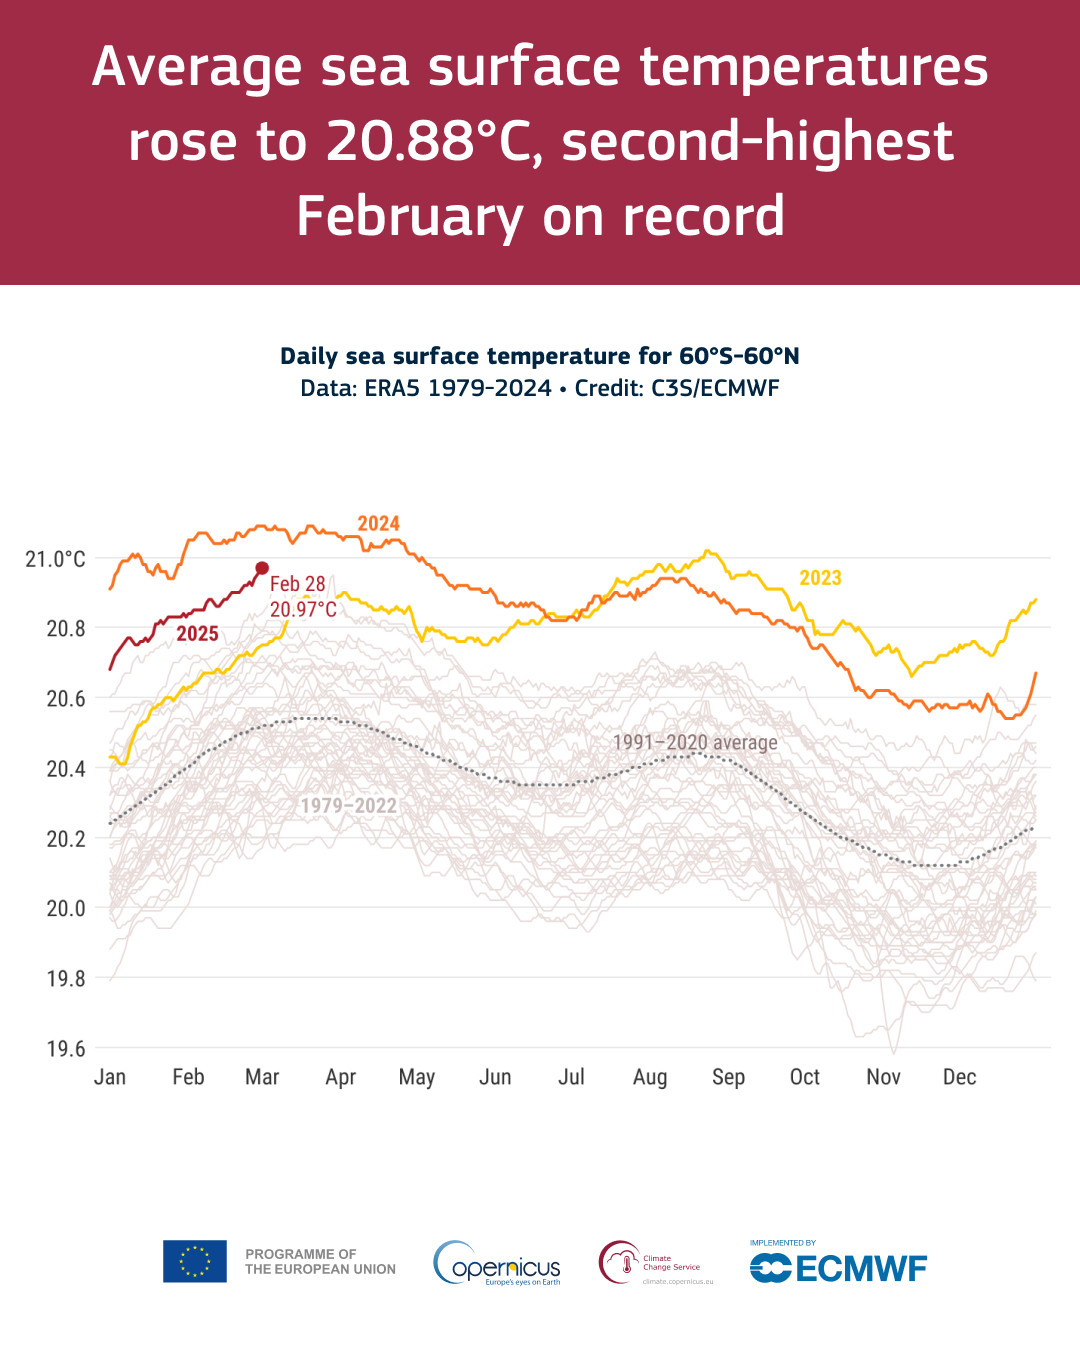
February marked an all-time record low for daily global #SeaIce extent: Arctic at 8% below average, Antarctic at 26% below. Get more data insight in the February 2025 Climate Bulletin produced by #C3S https://climate.copernicus.eu/sea-ice-cover-february-2025?utm_source=socialmedia&utm_medium=ma&utm_campaign=sea-ice-cover-february-2025&utm_id=CB-02-2025
February 2025 #C3S Climate Bulletin: Third warmest February globally. Global average temperature was 0.63°C above 1991-2020 average. 1.59°C above pre-industrial levels highlights persistent warming trends. Full Climate Bulletin: https://climate.copernicus.eu/surface-air-temperature-february-2025?utm_source=socialmedia&utm_medium=ma&utm_campaign=surface-air-temperature-february-2025&utm_id=CB-02-2025
Anticyclonic conditions leading to increased surface air pollution across much of Europe in early March. CAMS regional ensemble forecasts show NO2 and PM2.5 concentrations start to decrease from 6 March for nw. Europe. Check the forecasts for NO2: https://atmosphere.copernicus.eu/charts/packages/cams_air_quality/products/europe-air-quality-forecast-regulated?layer_name=composition_europe_no2_forecast_surface&level=key_0&originating_centre=85_2&projection=opencharts_europe
Identify methane hotspots with ease! Use the CAMS Methane Hotspot Explorer to access data on date, time, location, sources, and source rate directly from a 2D map or 3D globe. #CopernicusAtmosphere
Out now: the new report by WMO, IRENA and #C3S! Discover how global climate shifts impact renewable potential and how #C3S data aids in optimising energy systems to meet climate goals. https://climate.copernicus.eu/global-climate-and-energy-insights-collaborative-report-future-renewables?utm_source=socialmedia&utm_medium=ma&utm_campaign=global-climate-and-energy-insights-collaborative-report-future-renewables&utm_id=energy-report-2023
Did you know Copernicus Earth Observation services support biodiversity monitoring? Read how climate and atmospheric data provided by
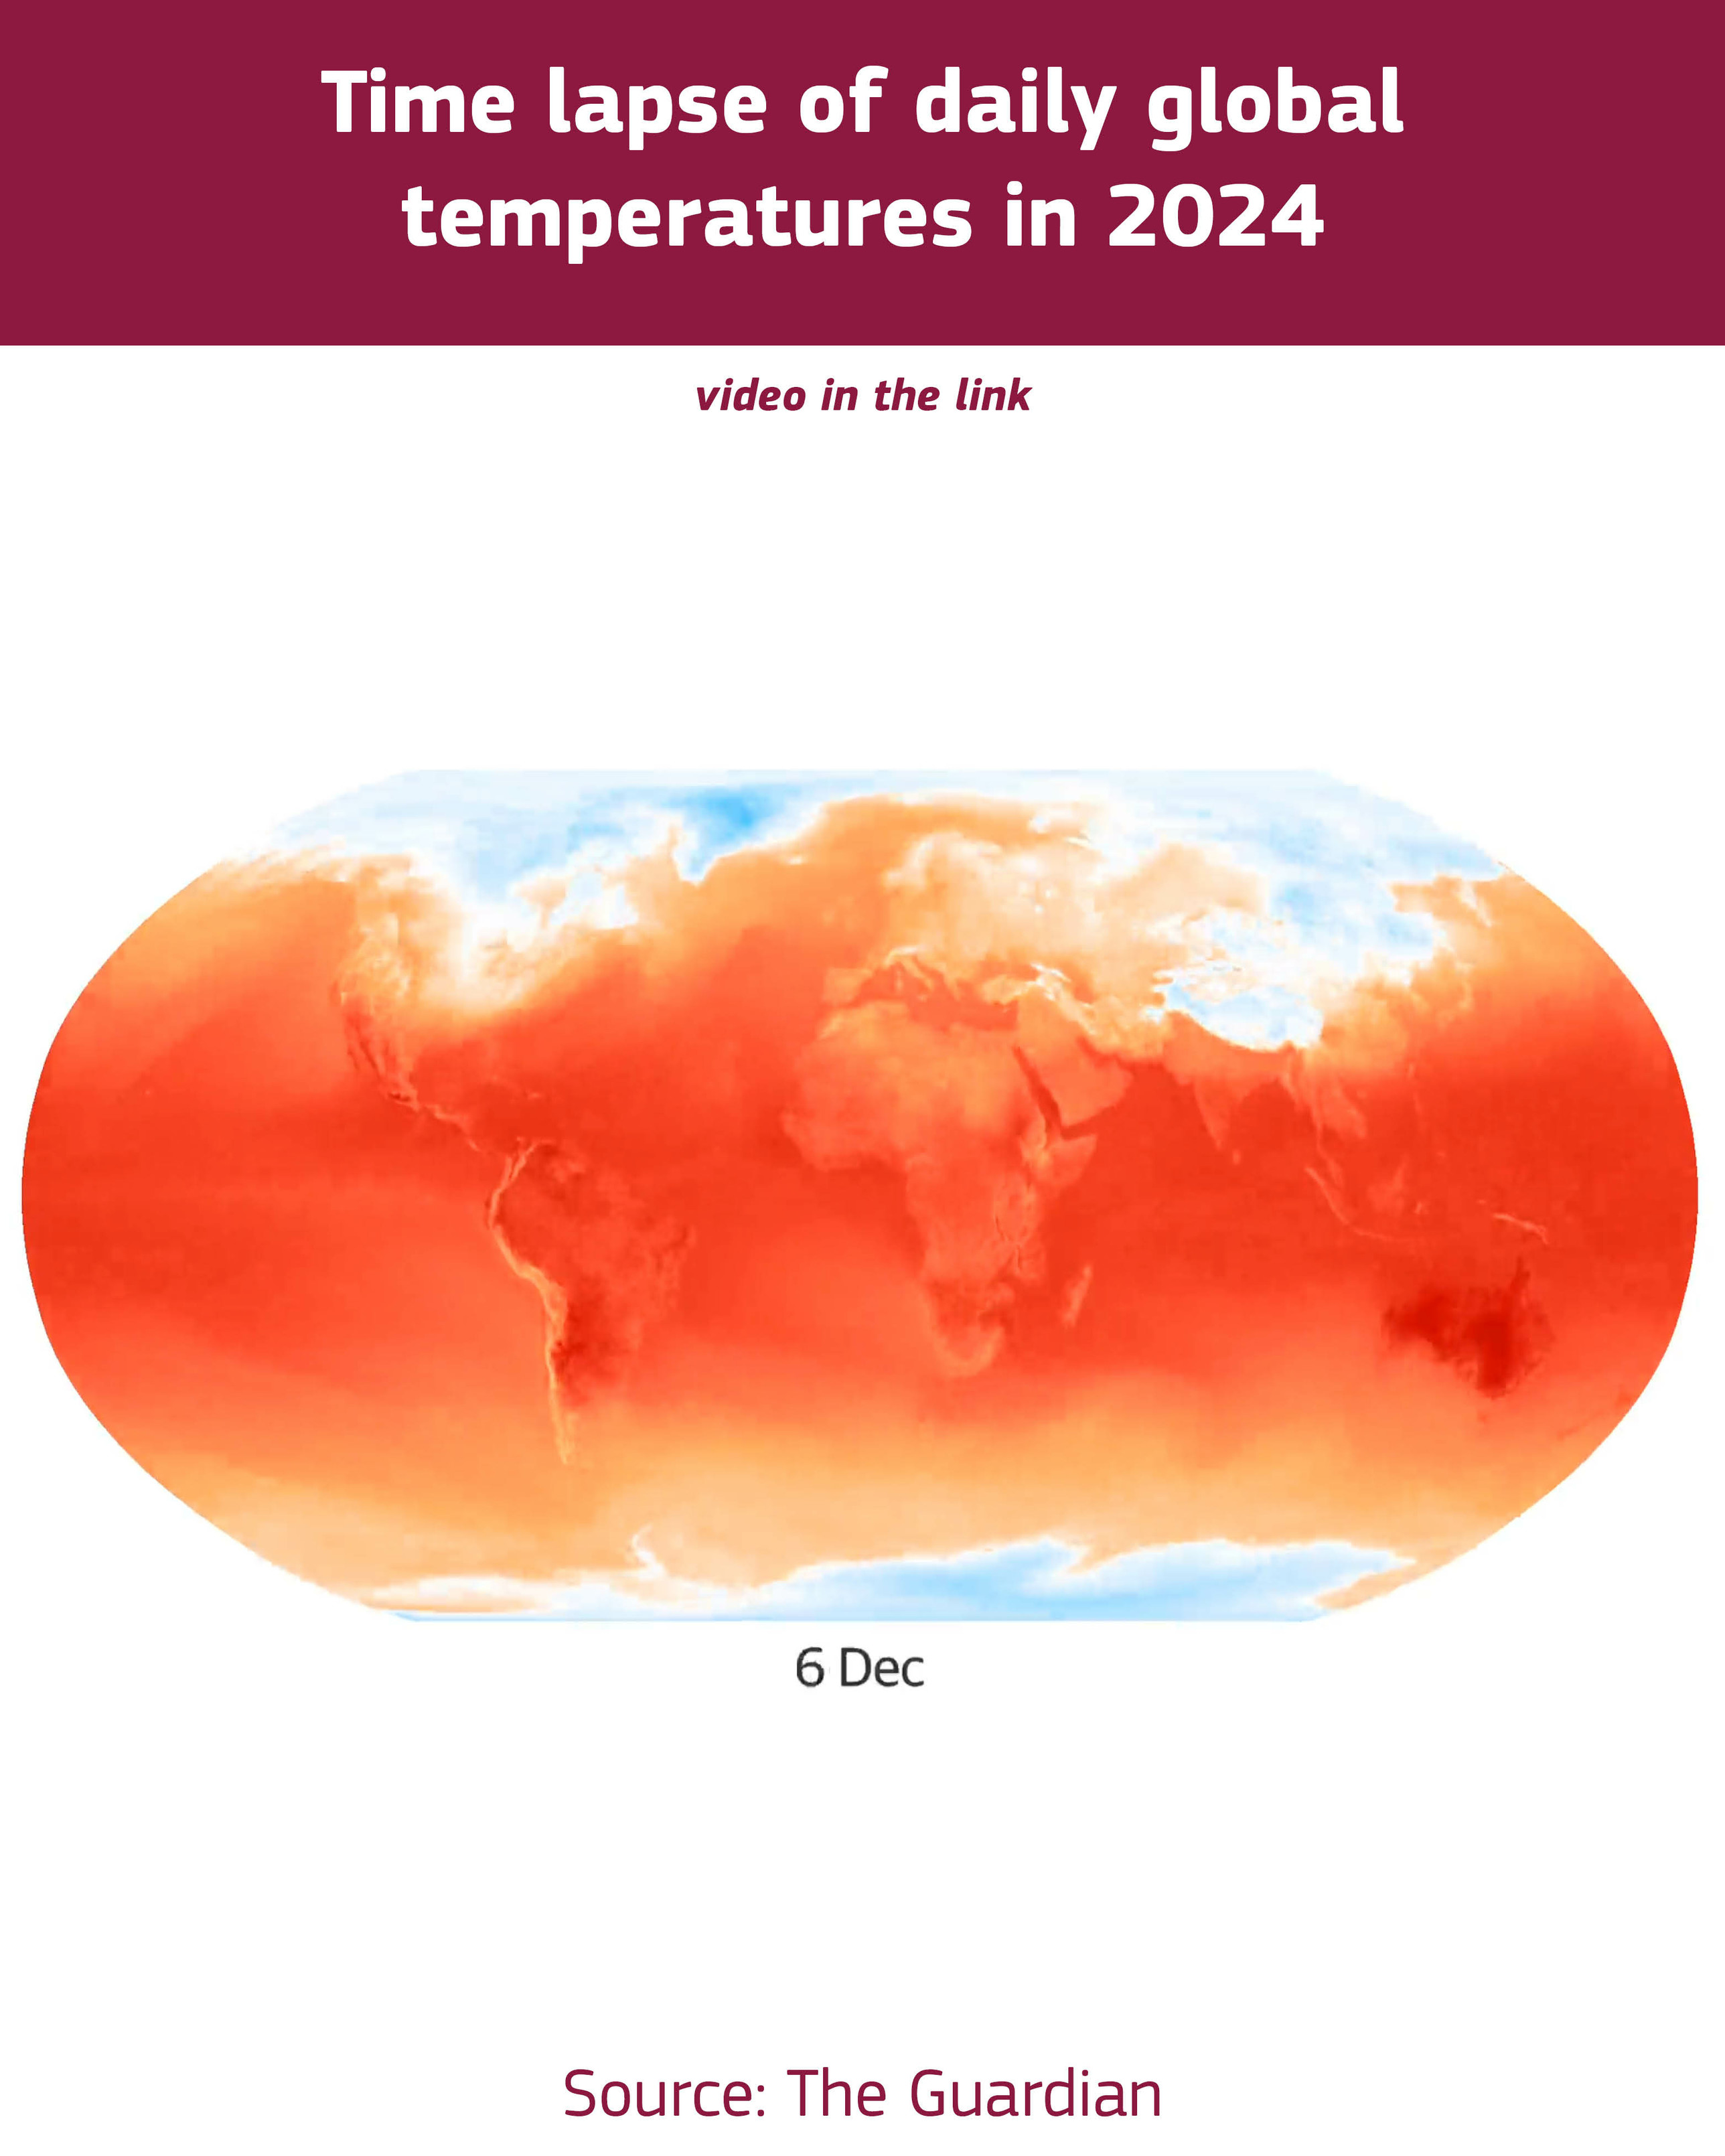
 #C3S and #CopernicusAtmosphere can enhance ecosystem assessments, informing policies and conservation efforts.
CAMS: https://atmosphere.copernicus.eu/how-copernicus-supports-biodiversity-role-c3s-and-cams?+=&utm_source=socialmedia&utm_medium=ma&utm_campaign=how-copernicus-supports-biodiversity-role-c3s-and-cams%3F+
C3S: https://climate.copernicus.eu/how-copernicus-supports-biodiversity-role-c3s-and-cams?utm_source=socialmedia&utm_medium=ma&utm_campaign=how-copernicus-supports-biodiversity-role-c3s-and-cams+++
Find out more about ERA5 reanalysis and other datasets available in the #C3S Climate Data Store CDS #ClimateChange.
https://climate.copernicus.eu/what-copernicus-climate-change-services-era5-reanalysis-dataset-and-what-can-it-do-you
https://cds.climate.copernicus.eu/#!/home
Relevant sources:
https://bsky.app/profile/theguardian.com/post/3lilxfzrjnt2e
https://bsky.app/profile/euclimateaction.bsky.social/post/3lhvidmoloc2r
https://bsky.app/profile/copernicusecmwf.bsky.social/post/3lhiqqdkwas2n
Read the latest Climate Bulletin: https://climate.copernicus.eu/january-2025-warmest-january-and-lowest-arctic-sea-ice-extent-month